
Scaleup Europe: a 4000+ fast growing ecosystem
Here are the Numbers
- Europe is home to approximately 4,200 fast growing, ICT scaleups in 45 countries, collectively raising about $58B in funding (equal to 0.33% of Europe’s GDP). A relatively young ecosystem with a lot of potential for growth that confirms the absolute leading position of UK in terms of number of scaleups (1,412, 34% of total) and capital raised (35% of the total available to scaleups in Europe), followed by Germany, France and Sweden at a distance.
- This is what emerged from the latest SEP Monitor on Scaleup Europe presented today by Mind the Bridge at the European Parliament, on the occasion of the celebration of StartUp Europe Awards (SEUA) final ceremony in Brussels, at the presence of President of the European Parliament, Antonio Tajani, President of the Committee of the Regions, Markku Markkula, and Commissioner Carlos Moedas.
- The new Report is the most comprehensive analysis regarding the status of European innovative high growing startups and shows a remarkable increase in the number of scaleups in recent years. Restricting the analysis only to the European Union, the number of scaleups goes down to 3,950 and the capital raised to $55.6B. Without the UK, in a potential post-Brexit situation, the number of European scaleups shrinks to 2,540 and capital raised to $35.4B (-36%).
- Sectors: E-commerce, Fintech and Hospitality drive the growth. Fintech, not surprisingly, attracts the most investment in UK, Gaming in the Nordics, E-Commerce in Germany.
- Scaleup Europe is also still far too venture capital driven: only 2% of the European Scaleups go public: 45% of the IPOs over $100M are completed in the U.S.
- The research identified also 86 “scalers” in Europe, raising cumulatively $25B, 43% of the overall capital. Only 14 countries have been able thus far to produce scalers (startups raising $100M+): 29 (34%) are from UK.
Brussels, June 7th, 2017 – Europe is home to approximately 4,200 fast growing, ICT scaleups in 45 countries, collectively raising about $58B in funding. A relatively young ecosystem with a lot of potential for growth that confirms the absolute leading position of UK in terms of number of scaleups (1,412, 34% of total) and capital raised (35% of the total available to scaleups in Europe), followed by Germany, France and Sweden at a distance.
This is what emerged from the latest SEP Monitor on Scaleup Europe presented today by Mind the Bridge and SEP – Startup Europe Partnership on the occasion of the celebration of StartUp Europe Awards (SEUA) final ceremony in Brussels at the presence of the President of the European Parliament, Antonio Tajani, President of the Committee of the Regions, Markku Markkula, and Commissioner Carlos Moedas.
“Scaleup Europe is still young but it is doing well, I see a lot of potential for growth” – commented Andrus Ansip, European Commission Vice President for Digital Single Market – “Startup Europe Partnership data shows a remarkable increase in the number of scaleups in recent years. 2016 has been a turning point for Scaleup Europe as $12B of fresh capital poured into European scaleups. I am very pleased to see European startups on a firm scaleup path.”
The new Report is the most comprehensive analysis regarding the status of European innovative startups and shows a remarkable increase in the number of scaleups in recent years (on average, 67% of scaleups were established after 2010).
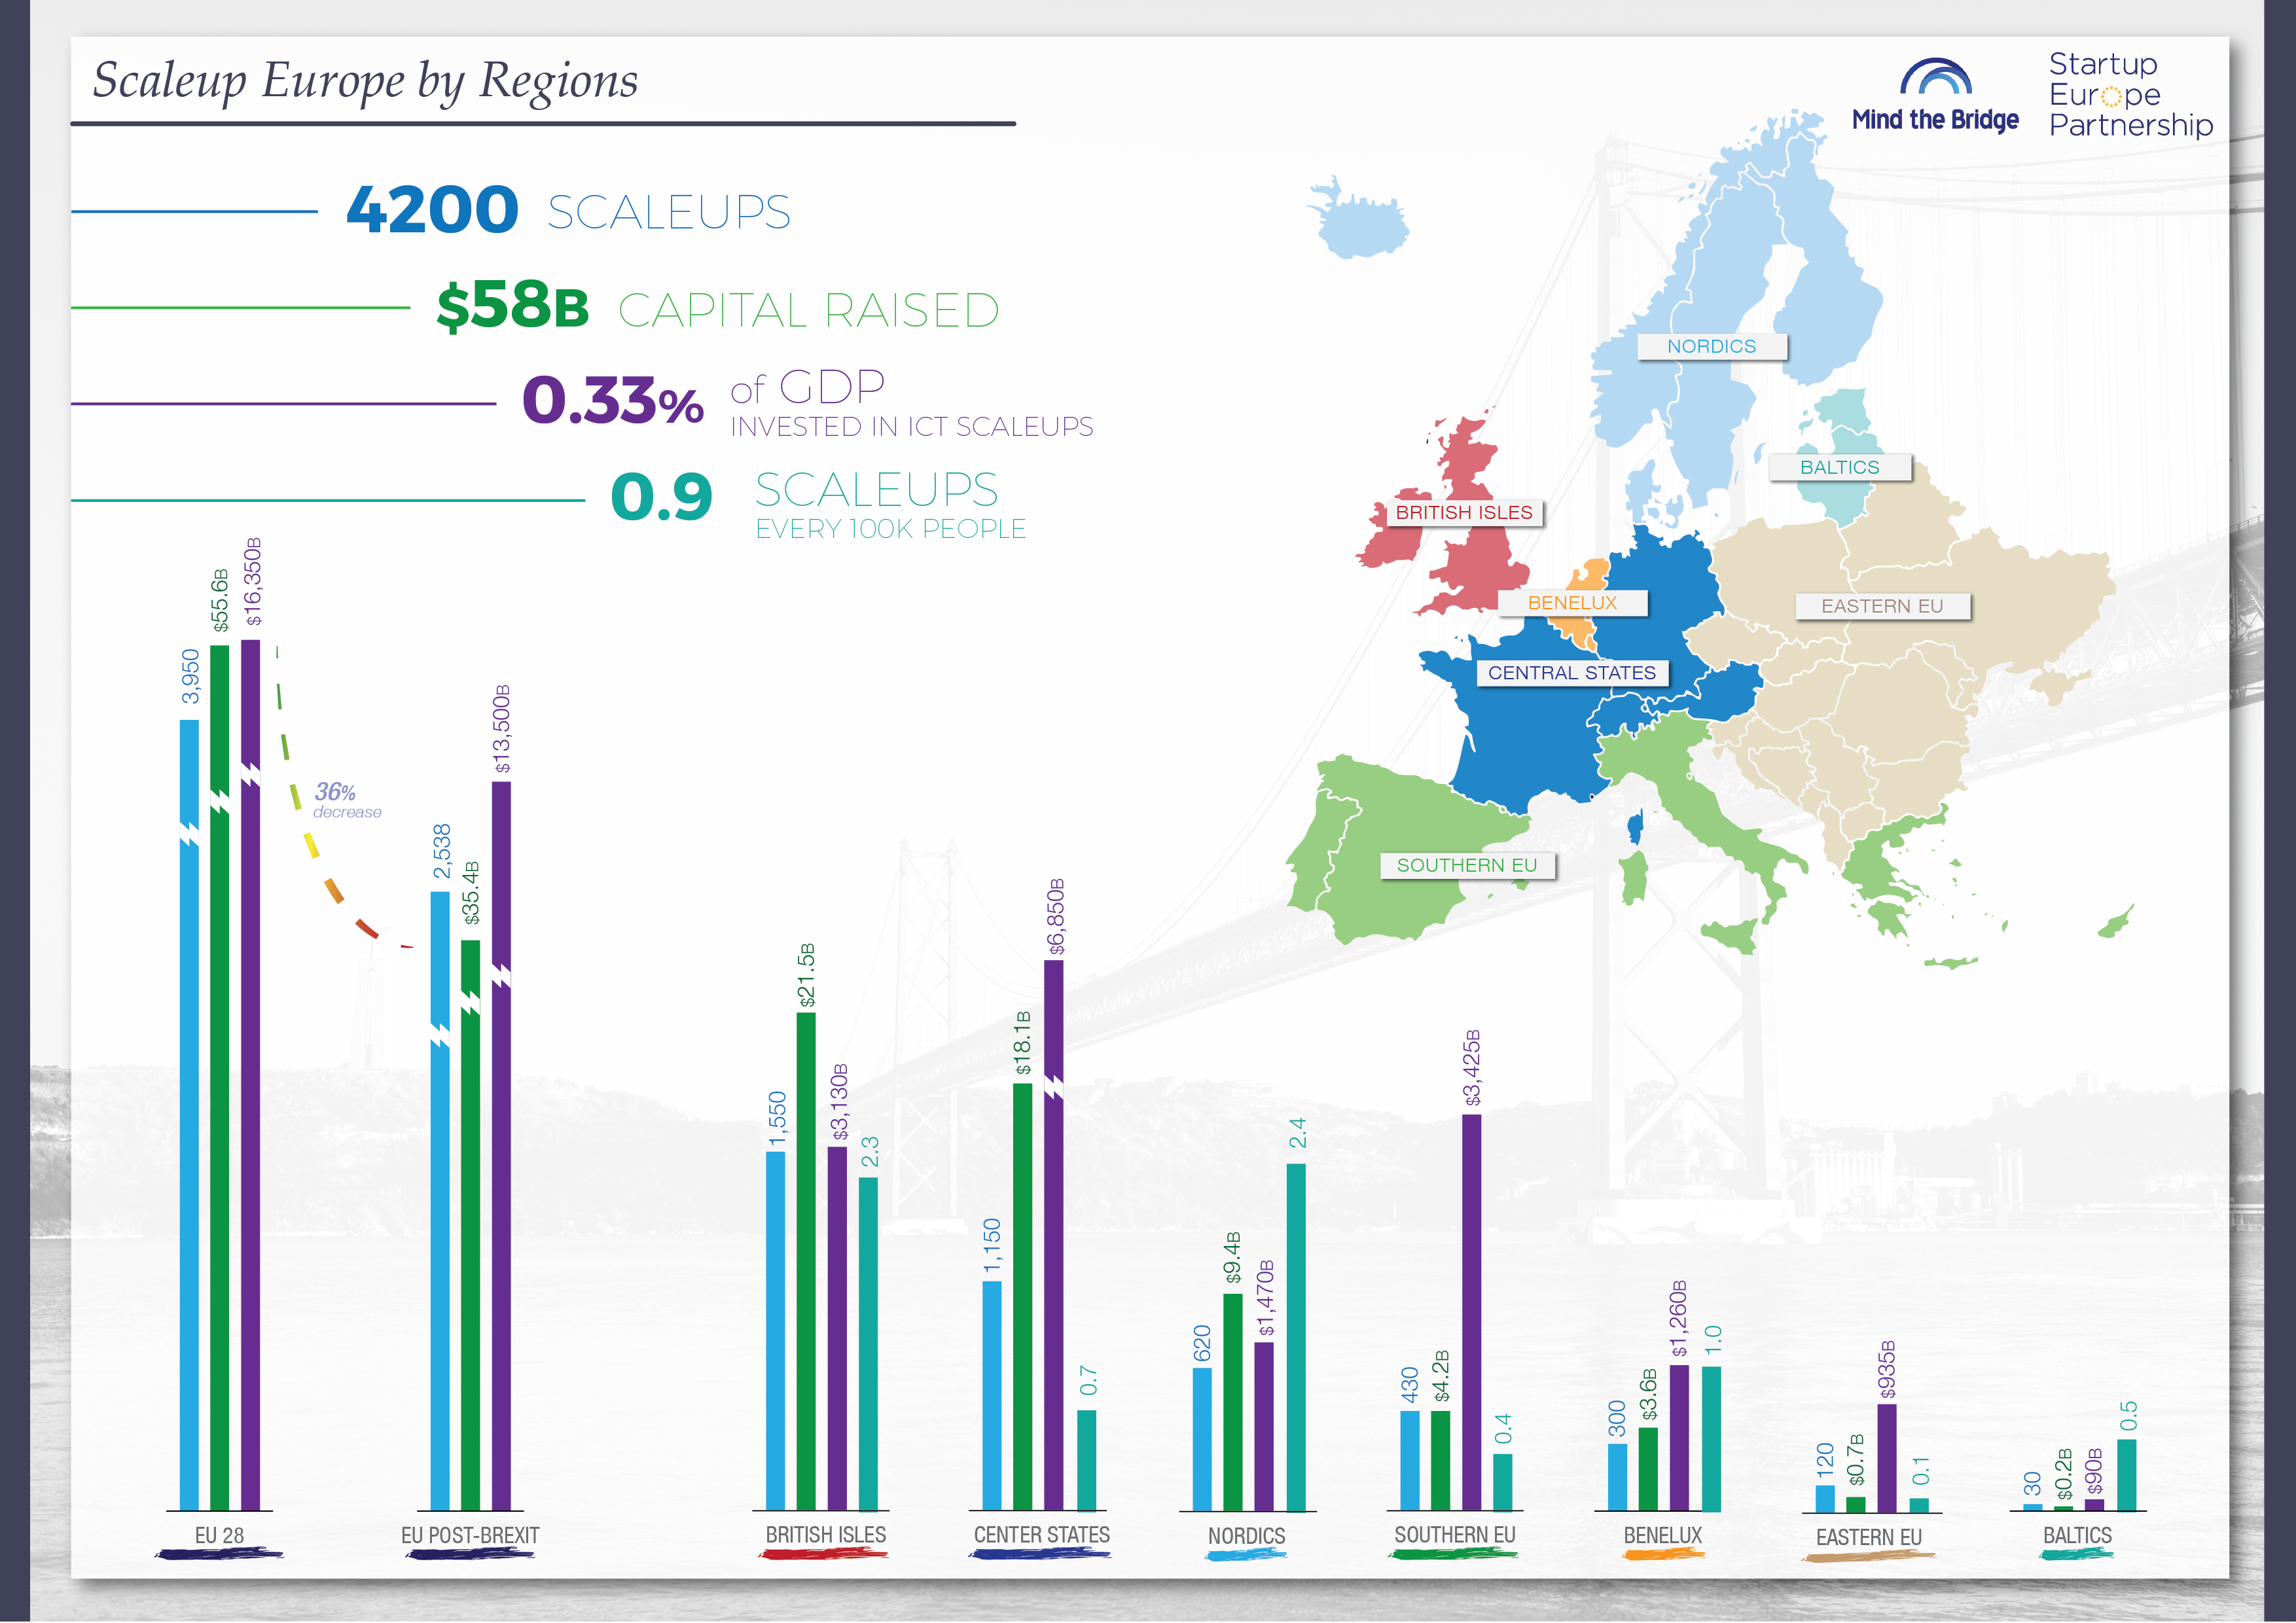
“Our research clearly shows the leading position of UK in the European Scaleup market for so long now – added Alberto Onetti, Chairman Mind the Bridge and Startup Europe Partnership (SEP) Coordinator, who presented the Report – In fact, if we consider this scenario without the UK, in a potential post-Brexit situation, the number of European scaleups shrinks from 4,000 to 2,540 and capital raised from $56M to $35B. In short, Brexit will reduce Scaleup Europe by 36% and could consistently hurt the European Fintech industry”.
Scaleup Europe: the Rank
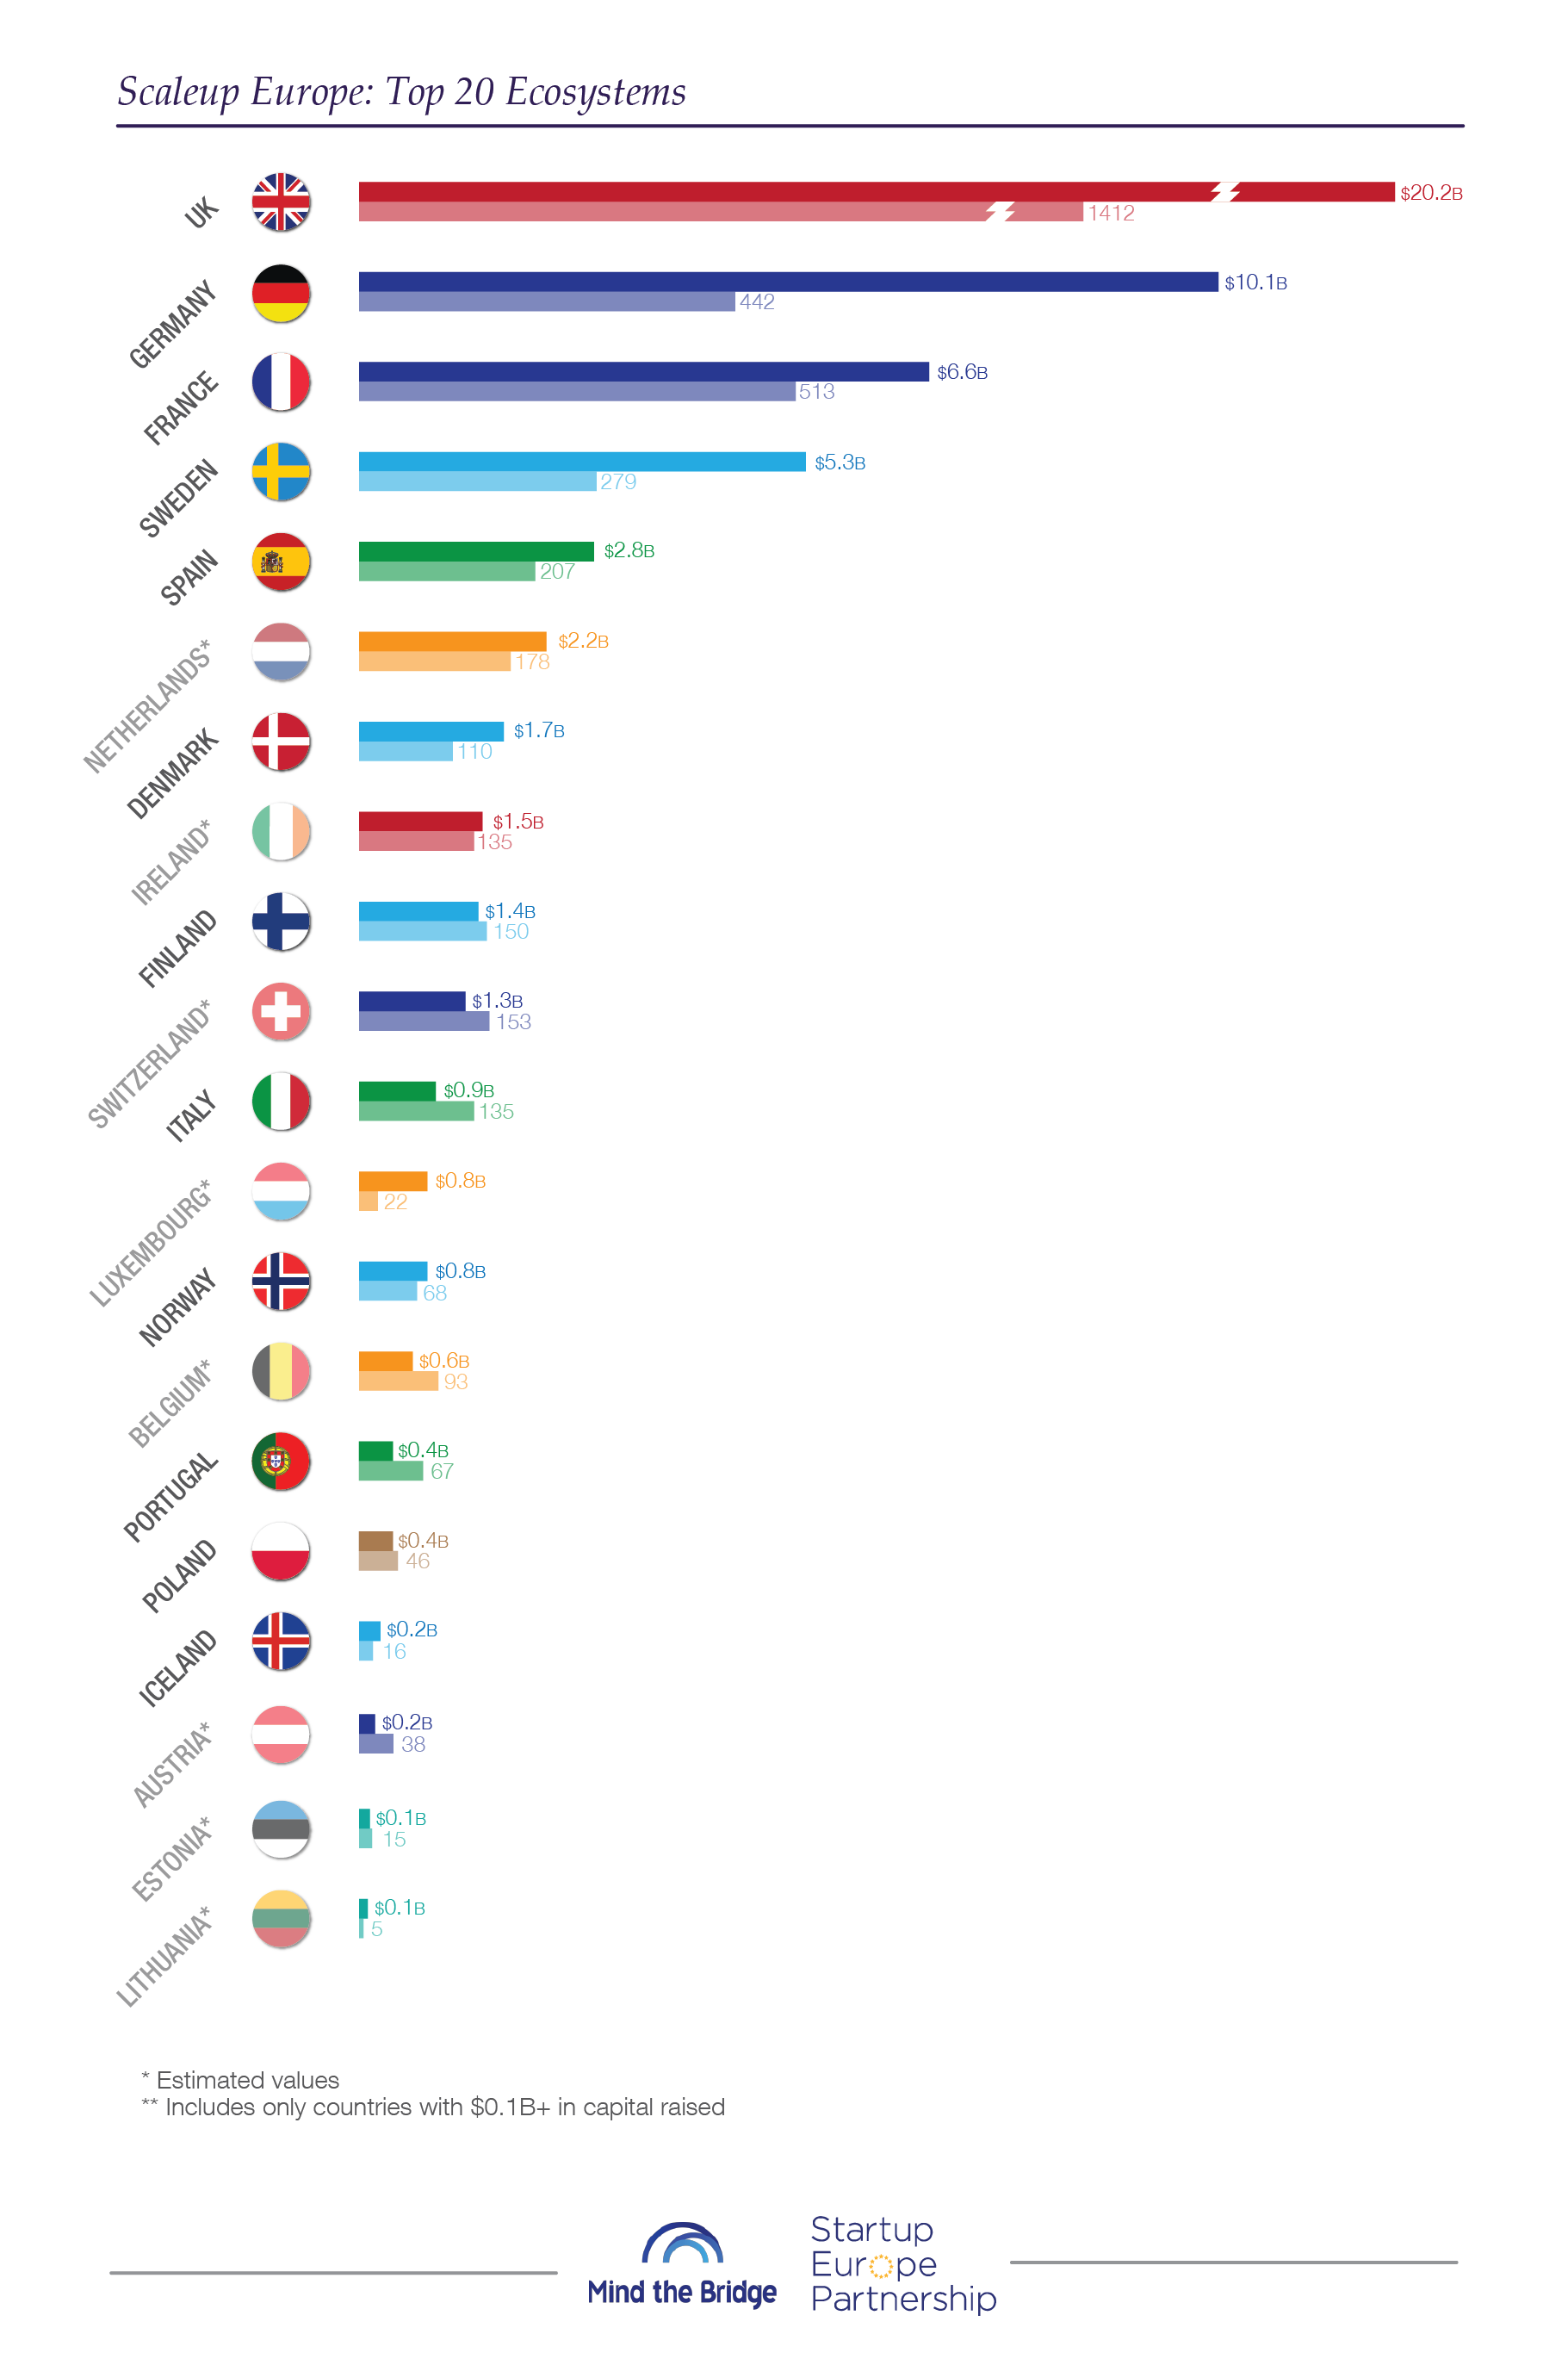 Germany comes in at a distant second after UK, with 442 scaleups (11% of the total) that raised $10.1B (17%). In terms of the number of scaleups, Germany is slightly less than one third of UK with approximately half of the capital raised. France has a larger number of 513 scaleups (12%, about 1.2 times more than Germany), but a lower amount of capital raised ($6.6M, 11% of the total funding). Sweden ranks number four with 279 scaleups (7% of total) able to raise $5.3B (9%). To be noted that, out of the $5.3B, $2.1B come from Spotify only. If we exclude the amount collected by Spotify, Sweden’s figures are closer to Spain, who immediately follows it ($2.8B raised by 207 scaleups). The Netherlands lead the Benelux pack with 178 scaleups (4%). Driven by the giant Adyen, they collectively raised $2.2B (slightly less than 4%). A group of five countries follow with a number of scaleups in the 100-150 range (2-3% of the total). It includes Denmark ($1.7B in capital raised), Ireland ($1.5B), Finland ($1.4), Switzerland ($1.3B), and Italy ($1B). Belgium (93 scaleups, $0.6B) and Norway (67 scaleups, $0.8B) precede a group of emerging ecosystems – including Portugal (68 scaleups, $0.4B), Poland (46 scaleups, $0.4B), Austria (38 scaleups, $0.2B), Luxembourg (22 scaleups but $0.8B raised) and, further off, Estonia and Lithuania – both of whom are showing a thriving attitude.
The Gap to be bridged: the Stock Markets
Scaleups and stock markets are not (yet) a good fit in Europe. Only 2% of the European Scaleups go public and approximately 15% of the overall amount raised in Europe has been collected through IPOs. To be noted that 45% of the IPOs over $100M are completed in the U.S. and that the scaleups that decide to go public in the U.S. raise about 6 times more capital than the ones that IPO in Europe.
It is not a coincidence that the top performing country in terms of scaleups (UK) shows also the highest percentage (19%) in terms of capital raised on the stock markets. Germany and France are below average (10% of capital raised via IPO).
Scaleup Europe is still far too venture capital driven. This poses a problem, because IPOs, beyond simply providing growth capital, offer exit opportunities to the VC funds. Without exits, the venture capital engine risks being flooded.
Scalers in Europe
The Report identified also 86 “Scalers”, i.e. scaleups able to raise over $100M – in Europe, representing 2% of the European scaleups and raising cumulatively $25B, 43% of the overall capital raised. Only 14 countries have been able thus far to produce scalers: 29 (34%) are from UK, double the number in Germany (15), which is then followed by France (11). Sweden comes in fourth place with 7 scalers, directly followed by Spain (6 scalers) and Denmark (5). In Luxembourg, scalers accounted for the largest percentage of capital raised by scaleups (71%), followed by Sweden (62%), Germany (55%), Denmark (50%), and Spain (47%). 4 scalers raised more than $1 billion in funding: Markit (UK), Delivery Hero and Zalando (Germany) and Spotify (Sweden). Those 4 “super scalers” managed to raise $6B cumulatively, representing the 12% of the total funding secured by the European scaleups.
E-Commerce and Fintech drive the growth
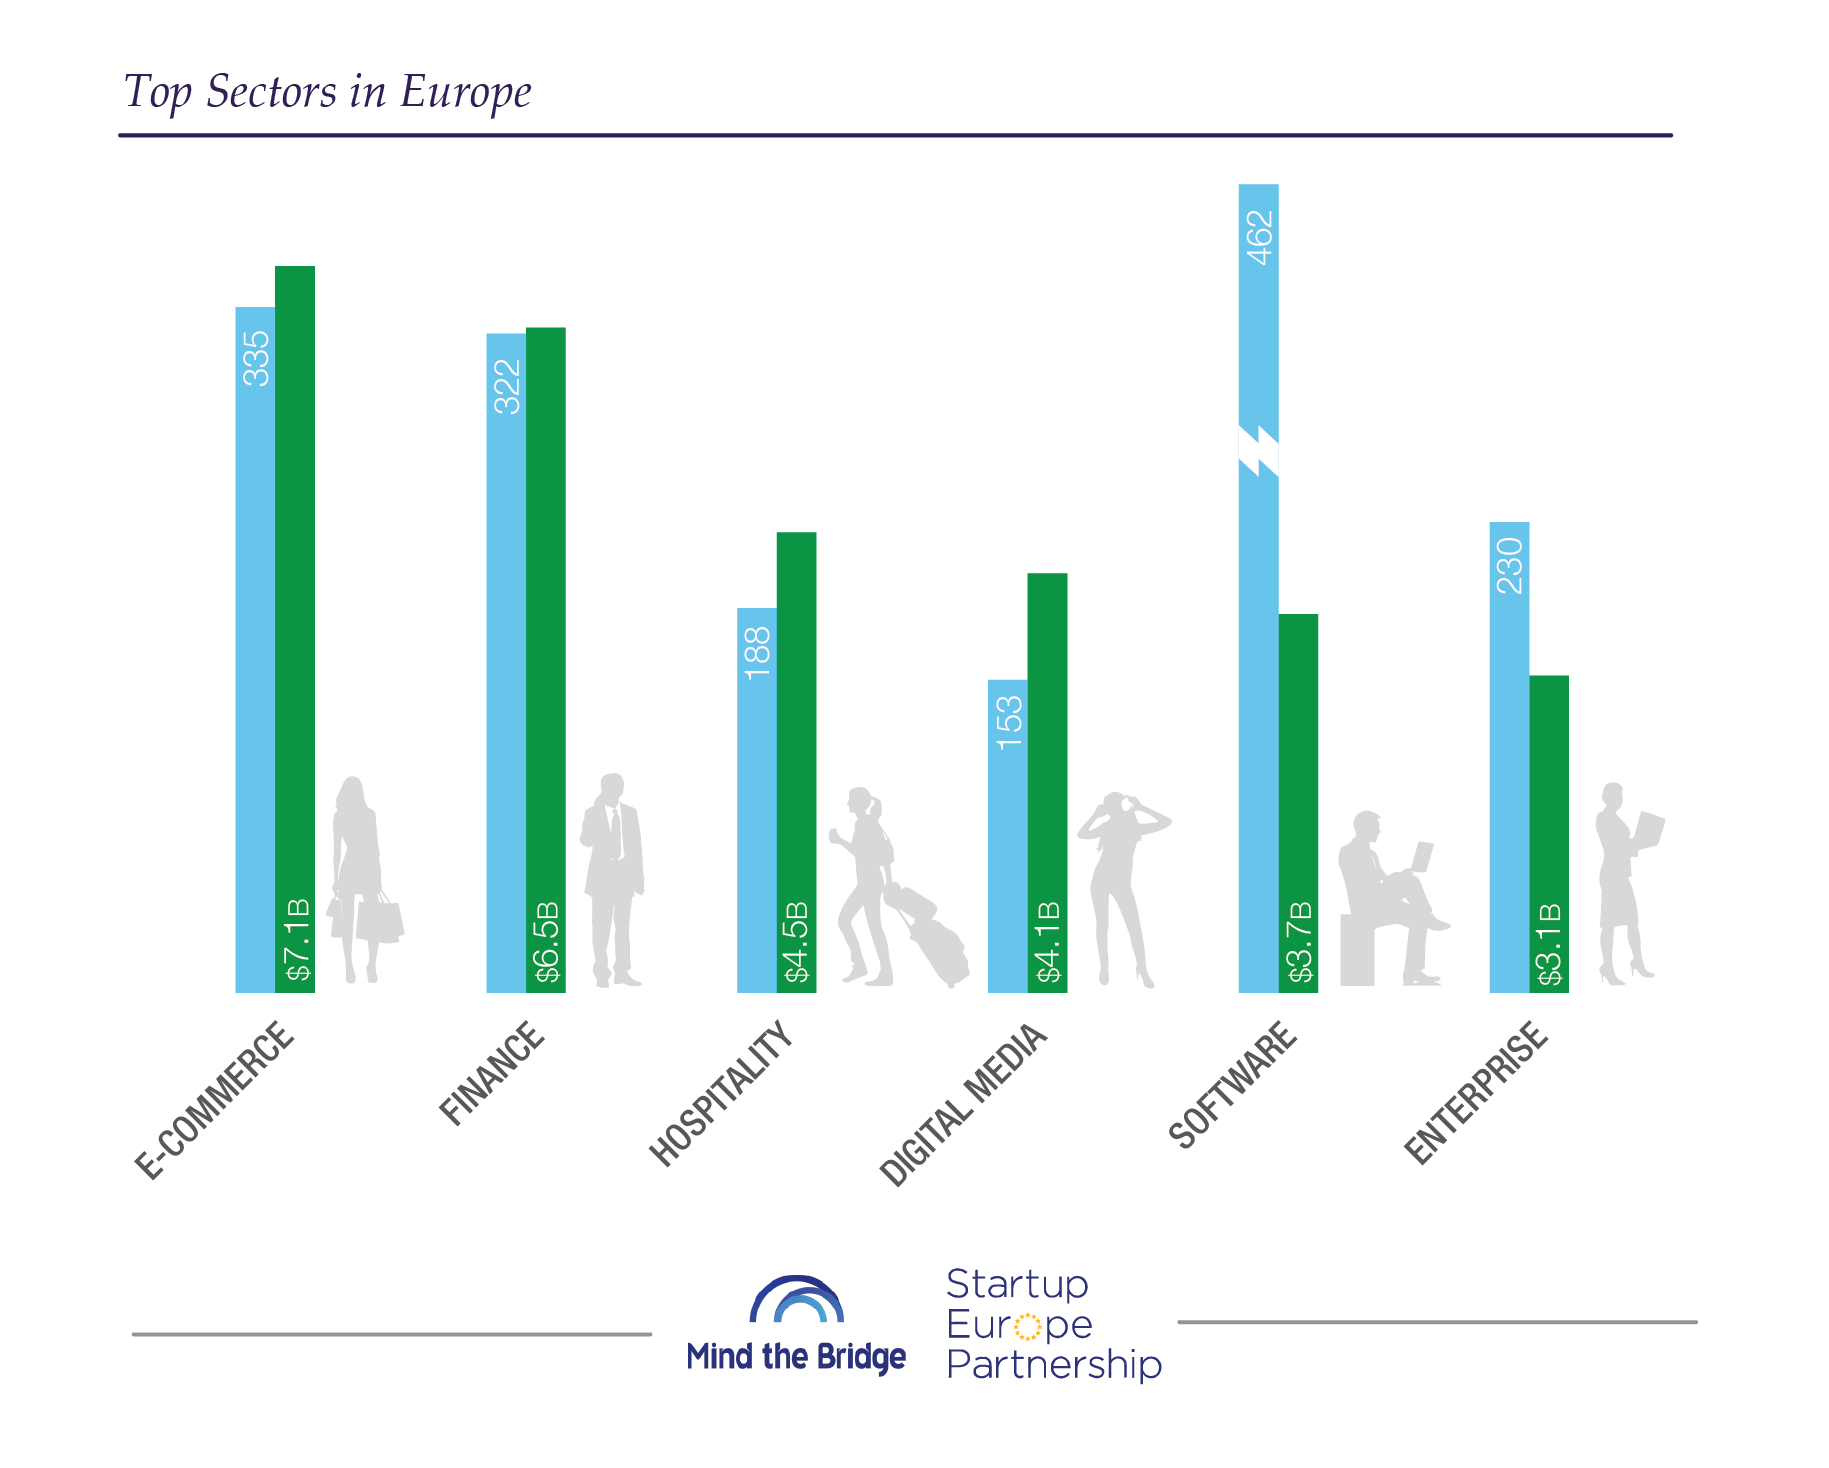 E-Commerce, Finance and Hospitality drive the growth of the European ICT scaleup ecosystems. 1 scaleup out of 5 in Europe operates in those sectors. Collectively, they raised $18.1B which is almost one third of the total capital made available to European scaleups.
Following are the Digital Media, Software Solutions and Enterprise Services sectors. It is worth noting that the highest concentration of scaleups resides in the Software sector, with more than 460 companies. The British Isles stand up as the land of Finance, with 22% of capital raised being collected by scaleups in that sector. This should not come as a surprise, considering that, among their scaler population, 1 out 3 operates in Finance.
The Central States are clearly driven by E-Commerce scaleups (22% of capital raised. Giants such as Zalando, Westwing, and Bestsecret.com are certainly responsible for this result. The Nordics maintain their status as the land of Gaming, as previously indicated by SEP, with new data confirming this trend, with 13% of total capital raised by Nordic scaleups injected in Gaming companies. In 2016, tech giants such as King.com, Supercell and their followers reaffirmed their supremacy and consistently foster ecosystem growth. The Southern European countries are driven by Fashion scaleups (14% of capital raised), with Mobile tech companies almost on par (13%) with them. The Eastern European countries are net producers of good software indeed, with companies operating in that sector attracting 18% of total capital.
*Methodological notes
The current analysis is based on analytical in-depth research for 12 countries (Denmark, Finland, France, Germany, Iceland, Italy, Norway, Poland, Portugal, Spain, Sweden, and the UK) that represent approximately 80% of Europe’s GDP. The data for the other remaining 33 countries has been estimated based on an exploratory analysis of multiple data sources and assumptions. Data are updated as of December 31st, 2016.
The current analysis is limited to ICT companies. Other key areas in the startup ecosystem, such as biotech/life science, hard-tech and cleantech, are currently under investigation and are not included.
SEP refers to “scaleup” as of startups that raised over $1 million (see Methodology for further details). This criterion may fail to consider startups that are scaling-up in a sustainable way (such as bootstrapped companies that grow organically and generate revenue and employment), although it includes startups that raised enormous seed investment while still in the “search phase”. Although the data fail to represent the complete scaleup landscape, we chose this methodology because it is the only one that allows an up-to-date “who’s who” of scaling-up in the various startup ecosystems. Furthermore, it is often not possible to report revenue and employment data (the real key variables to assess growth of a startup) as most cases are private companies, and many countries are simply not accessible in a timely manner.
SEP sources include public data (e.g. press articles, blogs), and direct information collected by investors and companies. The accuracy of our dataset is limited to the available information and disclosed data.
Comments are closed.